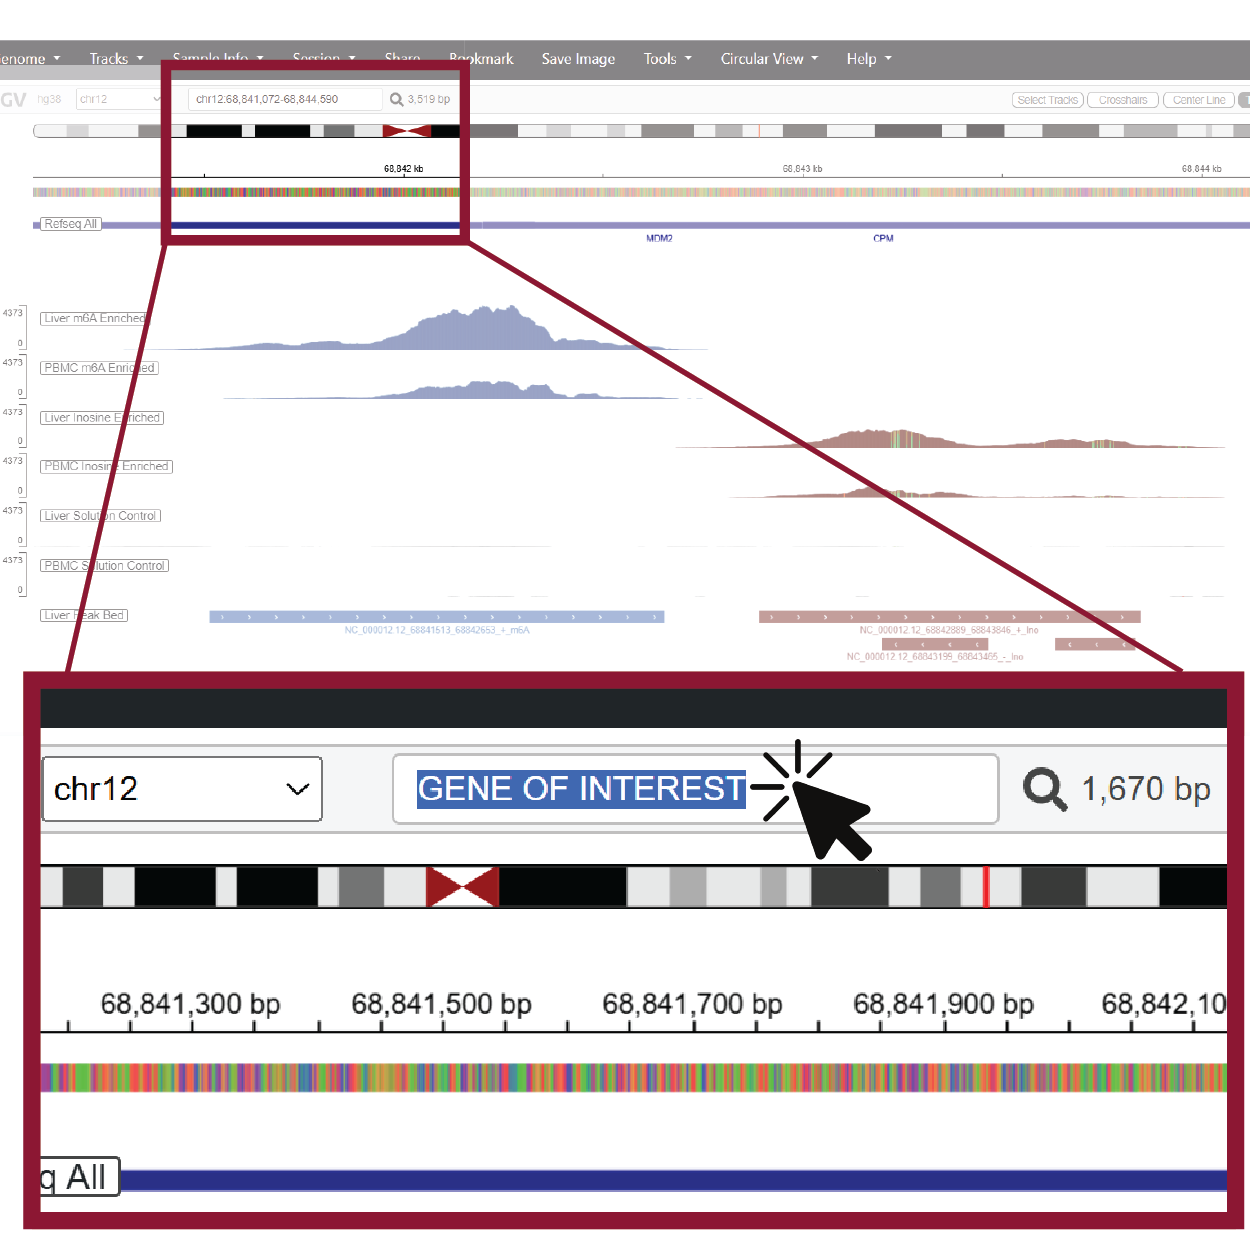
1. Use the search bar to navigate to other genes
The IGV search bar accepts gene names or genomic coordinates. Type a gene symbol or region into the box and press Enter, and the browser will jump directly to your region of interest.

Detect, visualize, and explore m6A, inosine, and RNA expression profiles generated with the EpiPlex™ Platform from healthy mouse cardiac tissue.
Click the button below to open a pre-configured IGV session and explore epitranscriptomic patterns in mouse cardiac tissue.
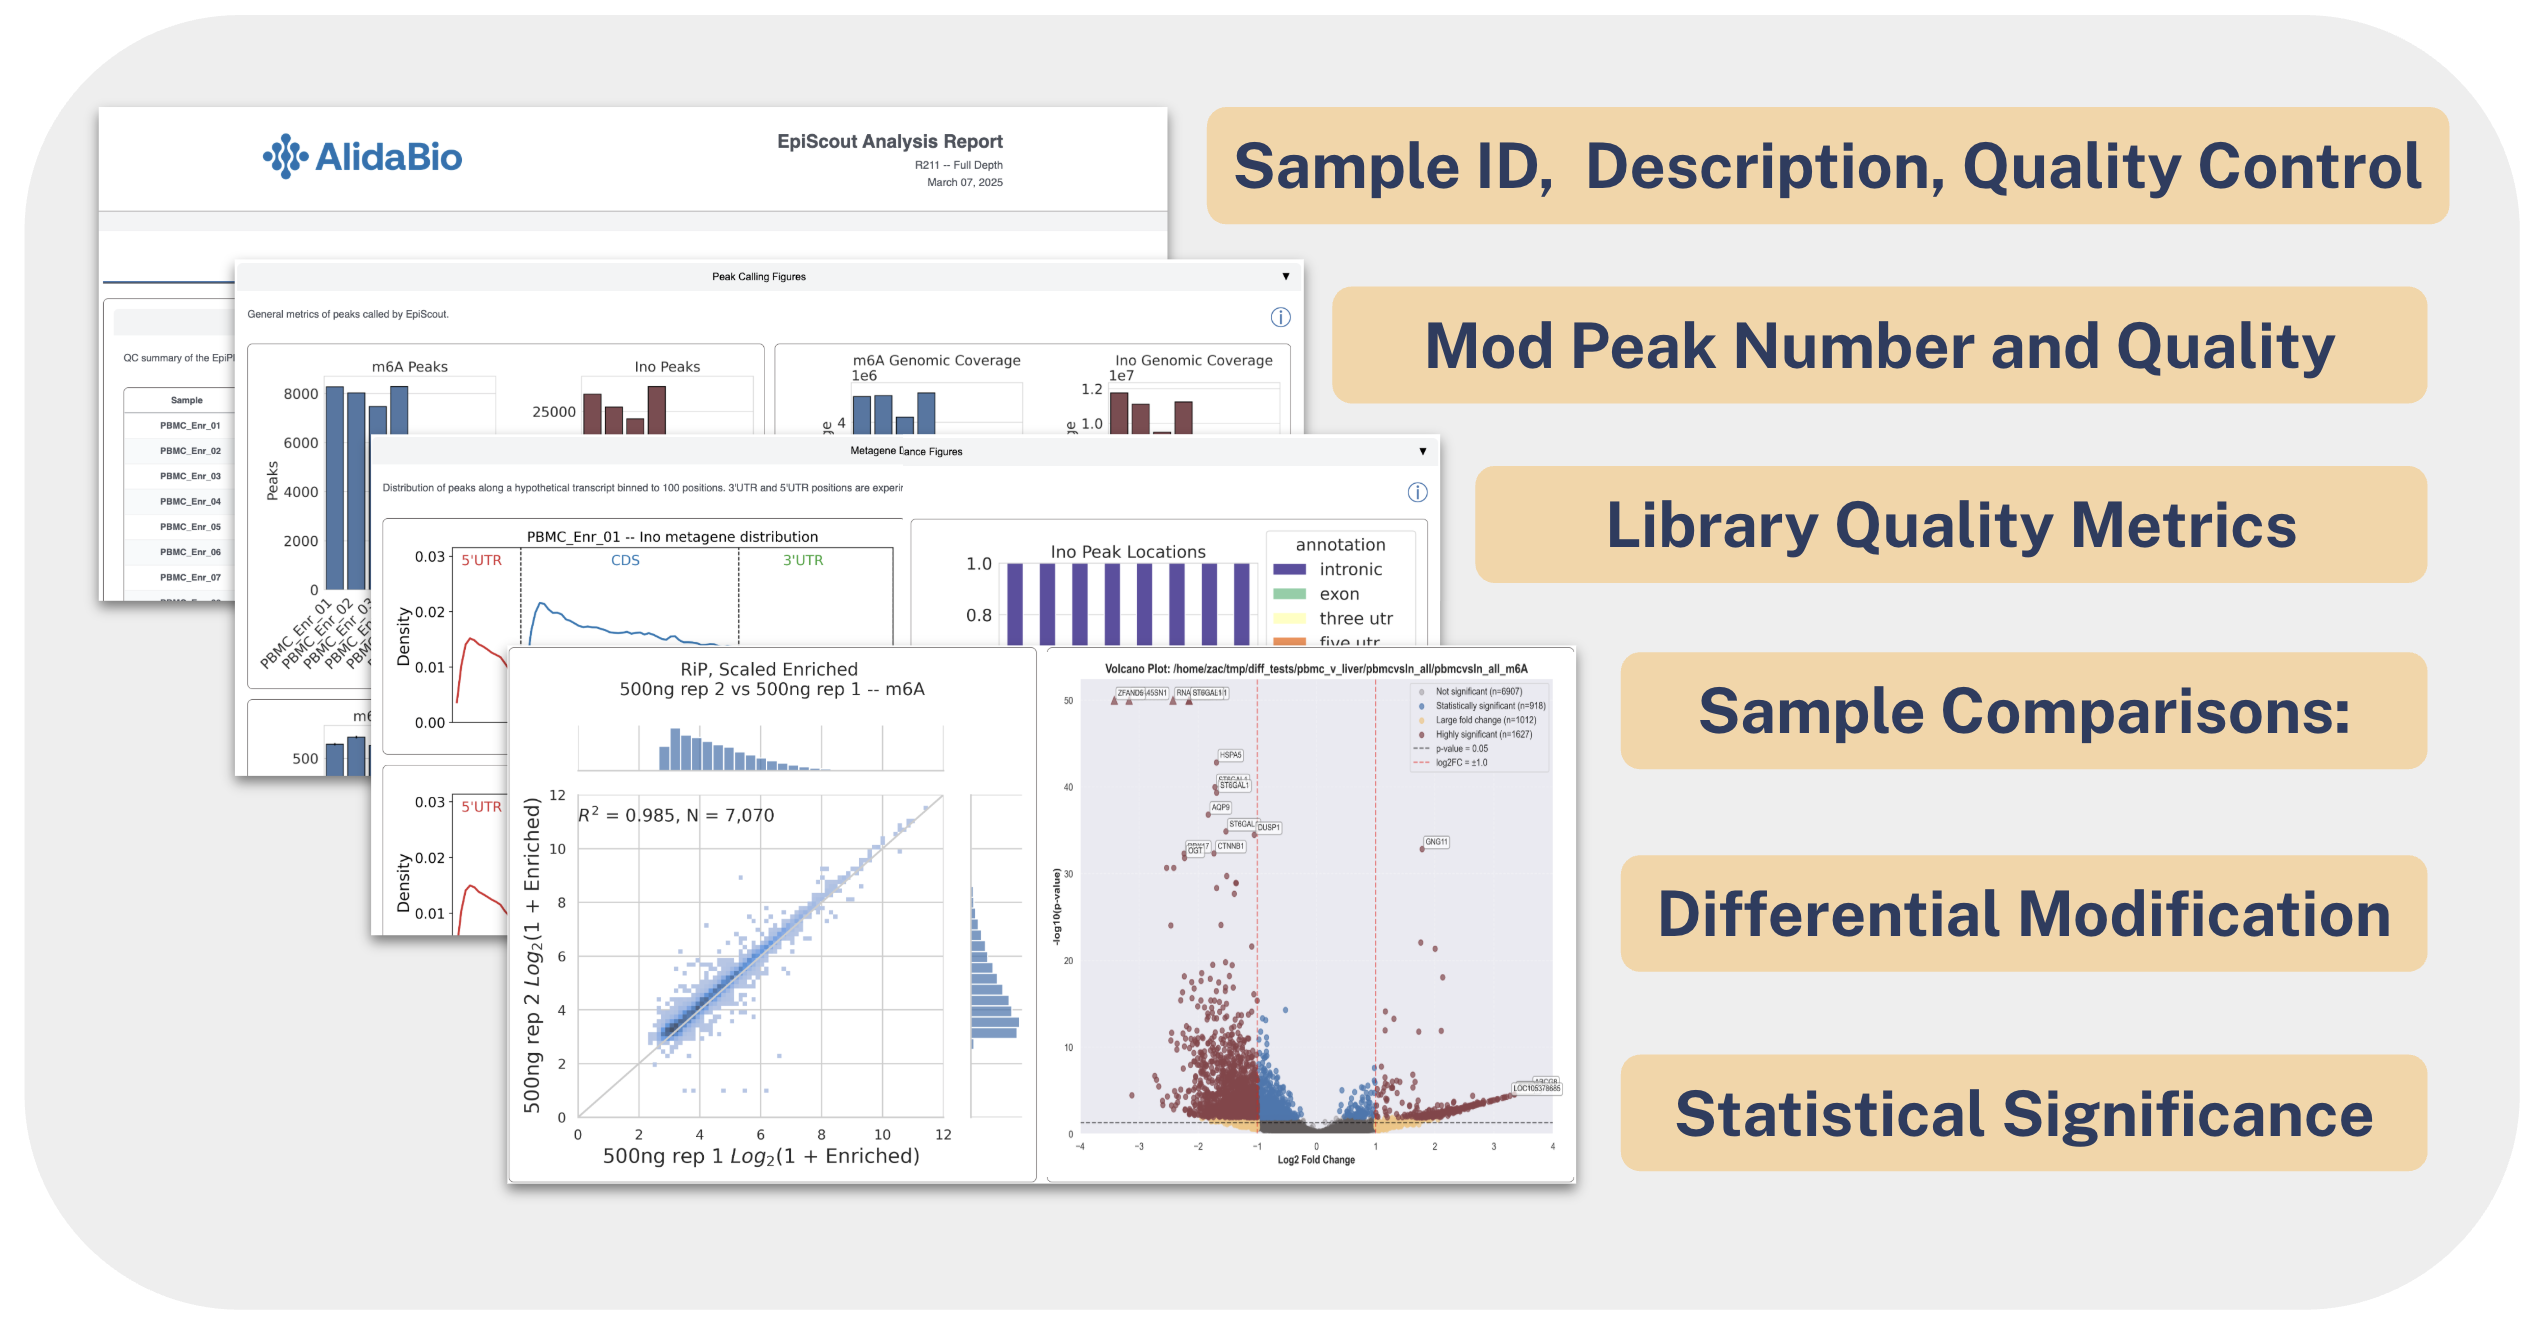
The EpiScout report provides a comprehensive overview of epitranscriptomic modifications detected in healthy mouse cardiac tissue, including m6A and inosine modifications alongside RNA expression profiles.
Click the button below to launch the IGV genome browser with pre-configured tracks showing m6A, inosine, and RNA-seq data from male and female mouse cardiac tissue samples.
Open IGV Browser Session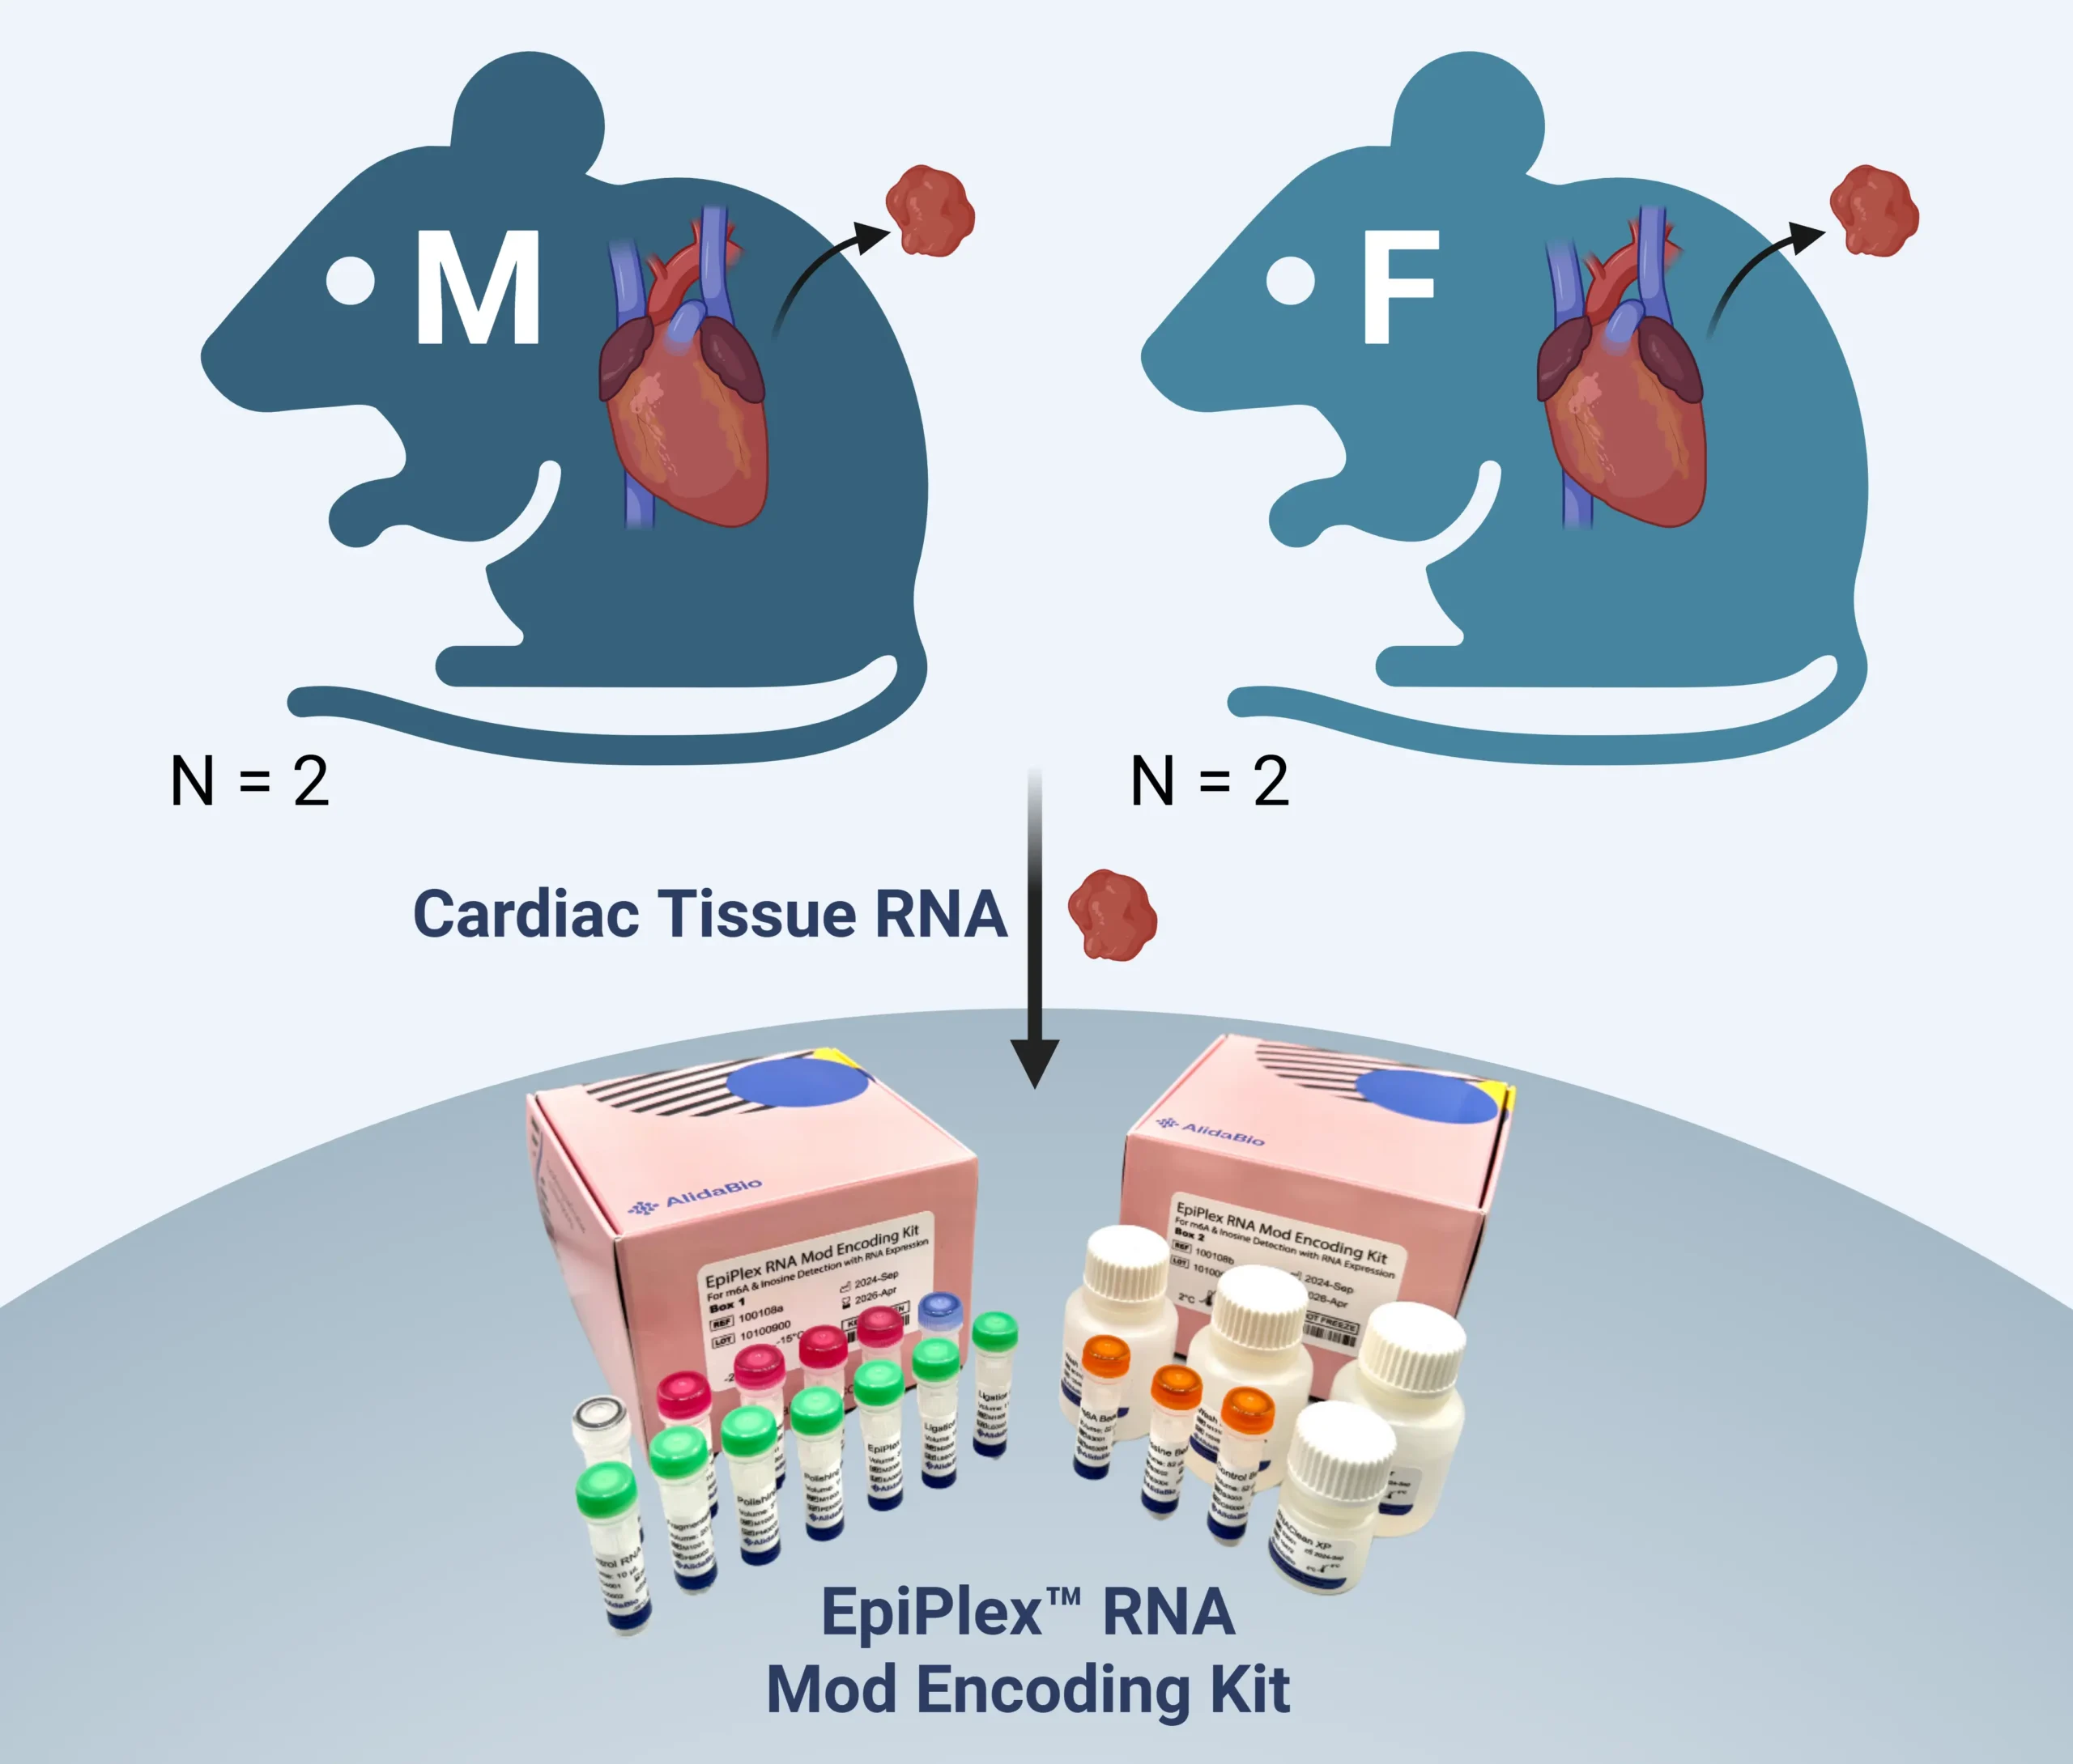
The IGV search bar accepts gene names or genomic coordinates. Type a gene symbol or region into the box and press Enter, and the browser will jump directly to your region of interest.
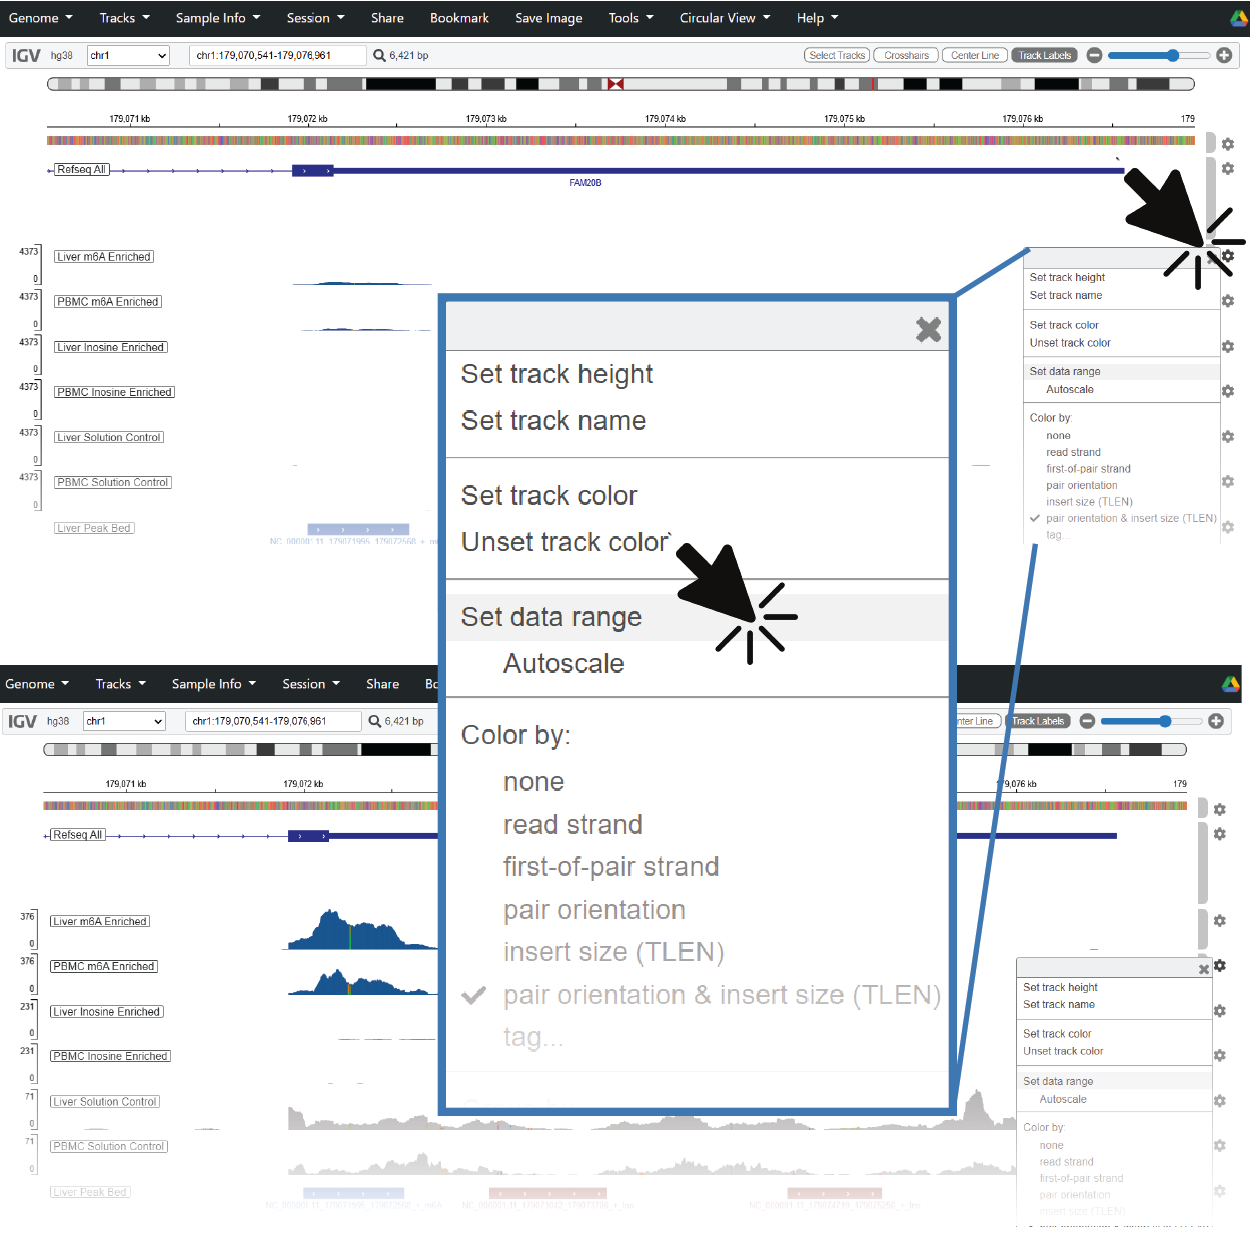
When you jump to a new region, coverage and modification tracks can span a wide dynamic range. If you don't see clear pileups or peak shapes, try right-clicking on the track to adjust the data range or enable autoscaling.
This dataset profiles epitranscriptomic signatures in healthy mouse cardiac tissue and is designed as a lightweight demo for interactive exploration.
Acknowledgments: Samples were prepared by the Hinson Lab at Jackson Laboratory and sent to AlidaBio for assay and analysis.