
EpiPlex™ Platform for m6A & Inosine Detection with RNA Expression
Detect, locate, and quantify multiple RNA modifications plus RNA expression, in one simple experiment.
EpiPlex™ RNA Mod Encoding Kit
Ordering Information
EpiPlex™ UDI Kit
Ordering Information
EpiScout™ Compute Token
Ordering Information

EpiPlex™ Platform Kit for m6A & Inosine Detection with RNA Expression
for highly reproducible, correlative data in a single reaction

Multi-modification Analysis
Read m6A and Inosine in one reaction.
Correlate changes between multiple modification types and find out which genes are up or downregulated in test and control conditions, and how the gene expression levels relate to RNA modification status. Identify equally expressed yet differentially modified genes to understand how the epitranscriptome modulates the proteome.

Relative Quantification
Compare relative RNA modification levels.
Only a subset of RNA transcripts of a given gene contains RNA modifications to fine-tune function. The EpiPlex assay includes spike-in controls as normalization standards to infer the modification stoichiometry of each gene. Normalizing the assay signals in this way also reduces assay variability and enables data comparisons across operators and experiment batches.

Low RNA Input
High performance with a broad RNA input range
Tissue biopsies often contain less than 500 ng of total RNA, challenging many RNA sequencing methods. With the EpiPlex assay you can achieve exceptional data quality with as little as 20 ng poly(A)-selected RNA or 250 ng total RNA—and even lower inputs have been tested successfully. Our user guides provide protocols for total, poly(A) and FFPE RNA to accommodate your research interests.

Streamlined Workflow
A simple 1-day library prep
Process up to 24 samples in parallel in a 7 hour library prep workflow with minimal hands-on time. Magnetic beads capture your precious RNA, minimizing losses during reaction steps. The format is ideal for multi-channel pipetting in strip tubes or plates.

Scalable Throughput
An automation friendly workflow
Scale beyond 24 samples by transferring the protocol to a liquid handler and process large sample cohorts. EpiPlex libraries can be multiplexed with other libraries on common short read sequencers. Kick off batch sample analysis and comparisons with a few mouse clicks using the EpiScout Cloud App hosted by DNAnexus.

Study Disease Biology
Study what truly interests you
Due to workflow limitations and variability researchers sometimes chose to limit their research to immobilized cell lines that can be grown in large quantities in the lab. With EpiPlex you can count on experimental success and there is no reason to shy away from profiling rare, hard to obtain sample types.
Product Features: EpiPlex™ RNA Mod Encoding Kit for m6A & Inosine Detection with RNA Expression
EpiScout Analysis Software
RNA modification and RNA expression analysis for all scientists

Seamless Data Processing
Upload your sequencing data and receive a comprehensive results report in a hands-off workflow

Machine Learning-Trained Peak Calling
Get accurate results with a custom tailored peak calling algorithms

Cloud App
Available as user-friendly cloud app via DNAnexus

EpiScout cloud-based access available on:
![]()
EpiScout Data Output
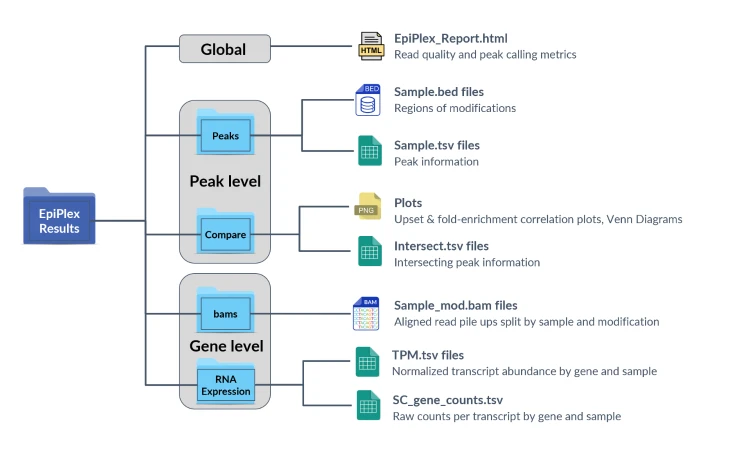
EpiScout™ Software identifies transcript regions with RNA
modifications and calculates their relative abundance
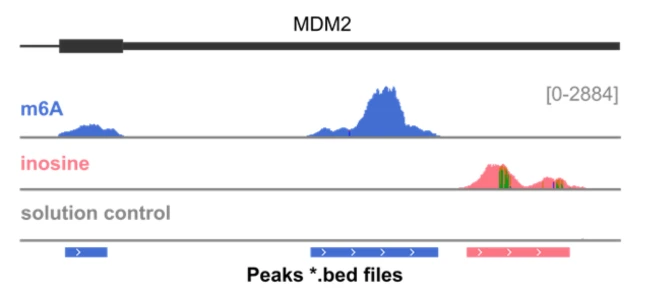
Genome browser view of the MDM2 gene, showing modified regions with m6A and inosine.
Sequencing data were trimmed, aligned, deduplicated and split by modification barcode, resulting in separate read tracks for m6A (blue), inosine (red) and the solution control (grey). Enrichment with EpiPlex binders generates peaks indicating the presence of RNA modifications. The y-axis corresponds to the number of sequencing reads and is proportional to the modification abundance, whereas the x-axis provides the location on the genome coordinate. Because inosine is read as a G in sequencing, its exact locations shows up as A-to-G mutation (vertical green line). The bed file at the bottom marks the peak locations, as identified by EpiScout peak caller.
EpiScout data are highly reproducible
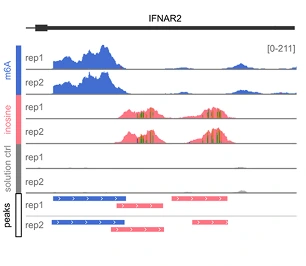
Genome browser view of the IFNAR2 gene, showing the raw reads for two technical replicates (rep1, rep2). The m6A and inosine peaks are highly reproducible.
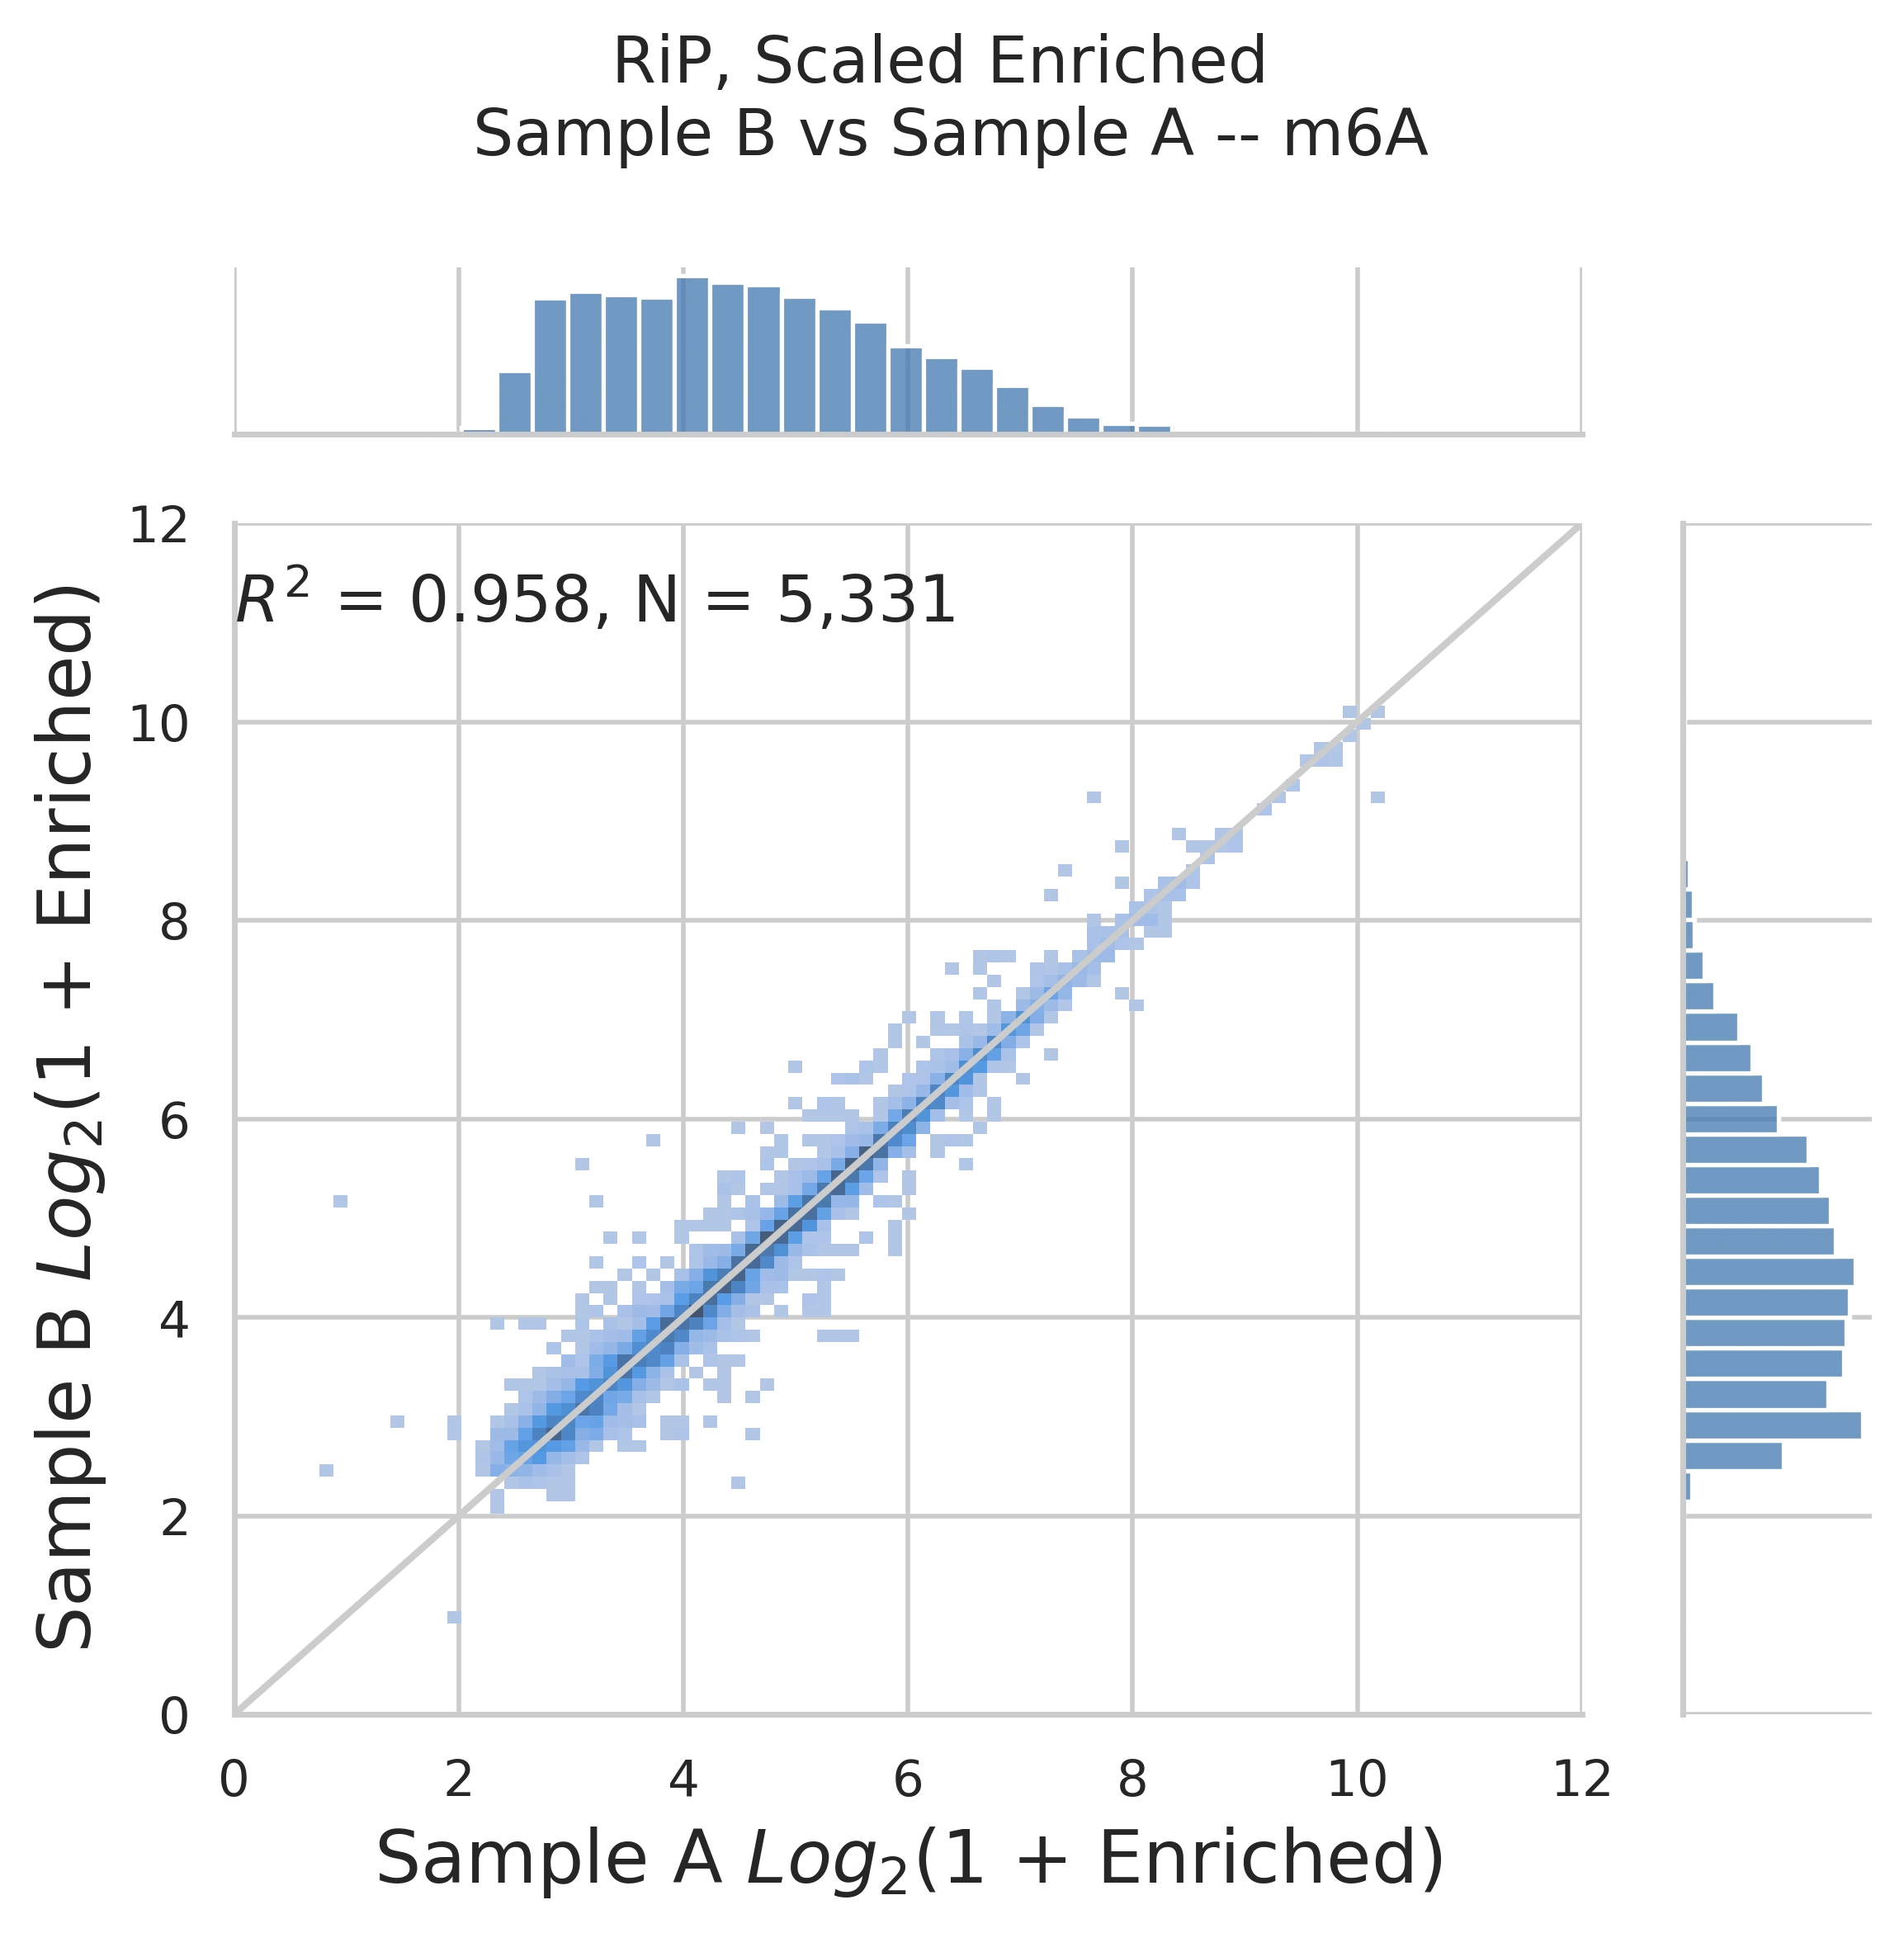
Correlation plot of the fold enrichment values of all m6A peaks found in rep1 versus the same in rep2. R2 > 0.8 demonstrates high reproducibility of the RNA mod abundance calculation.
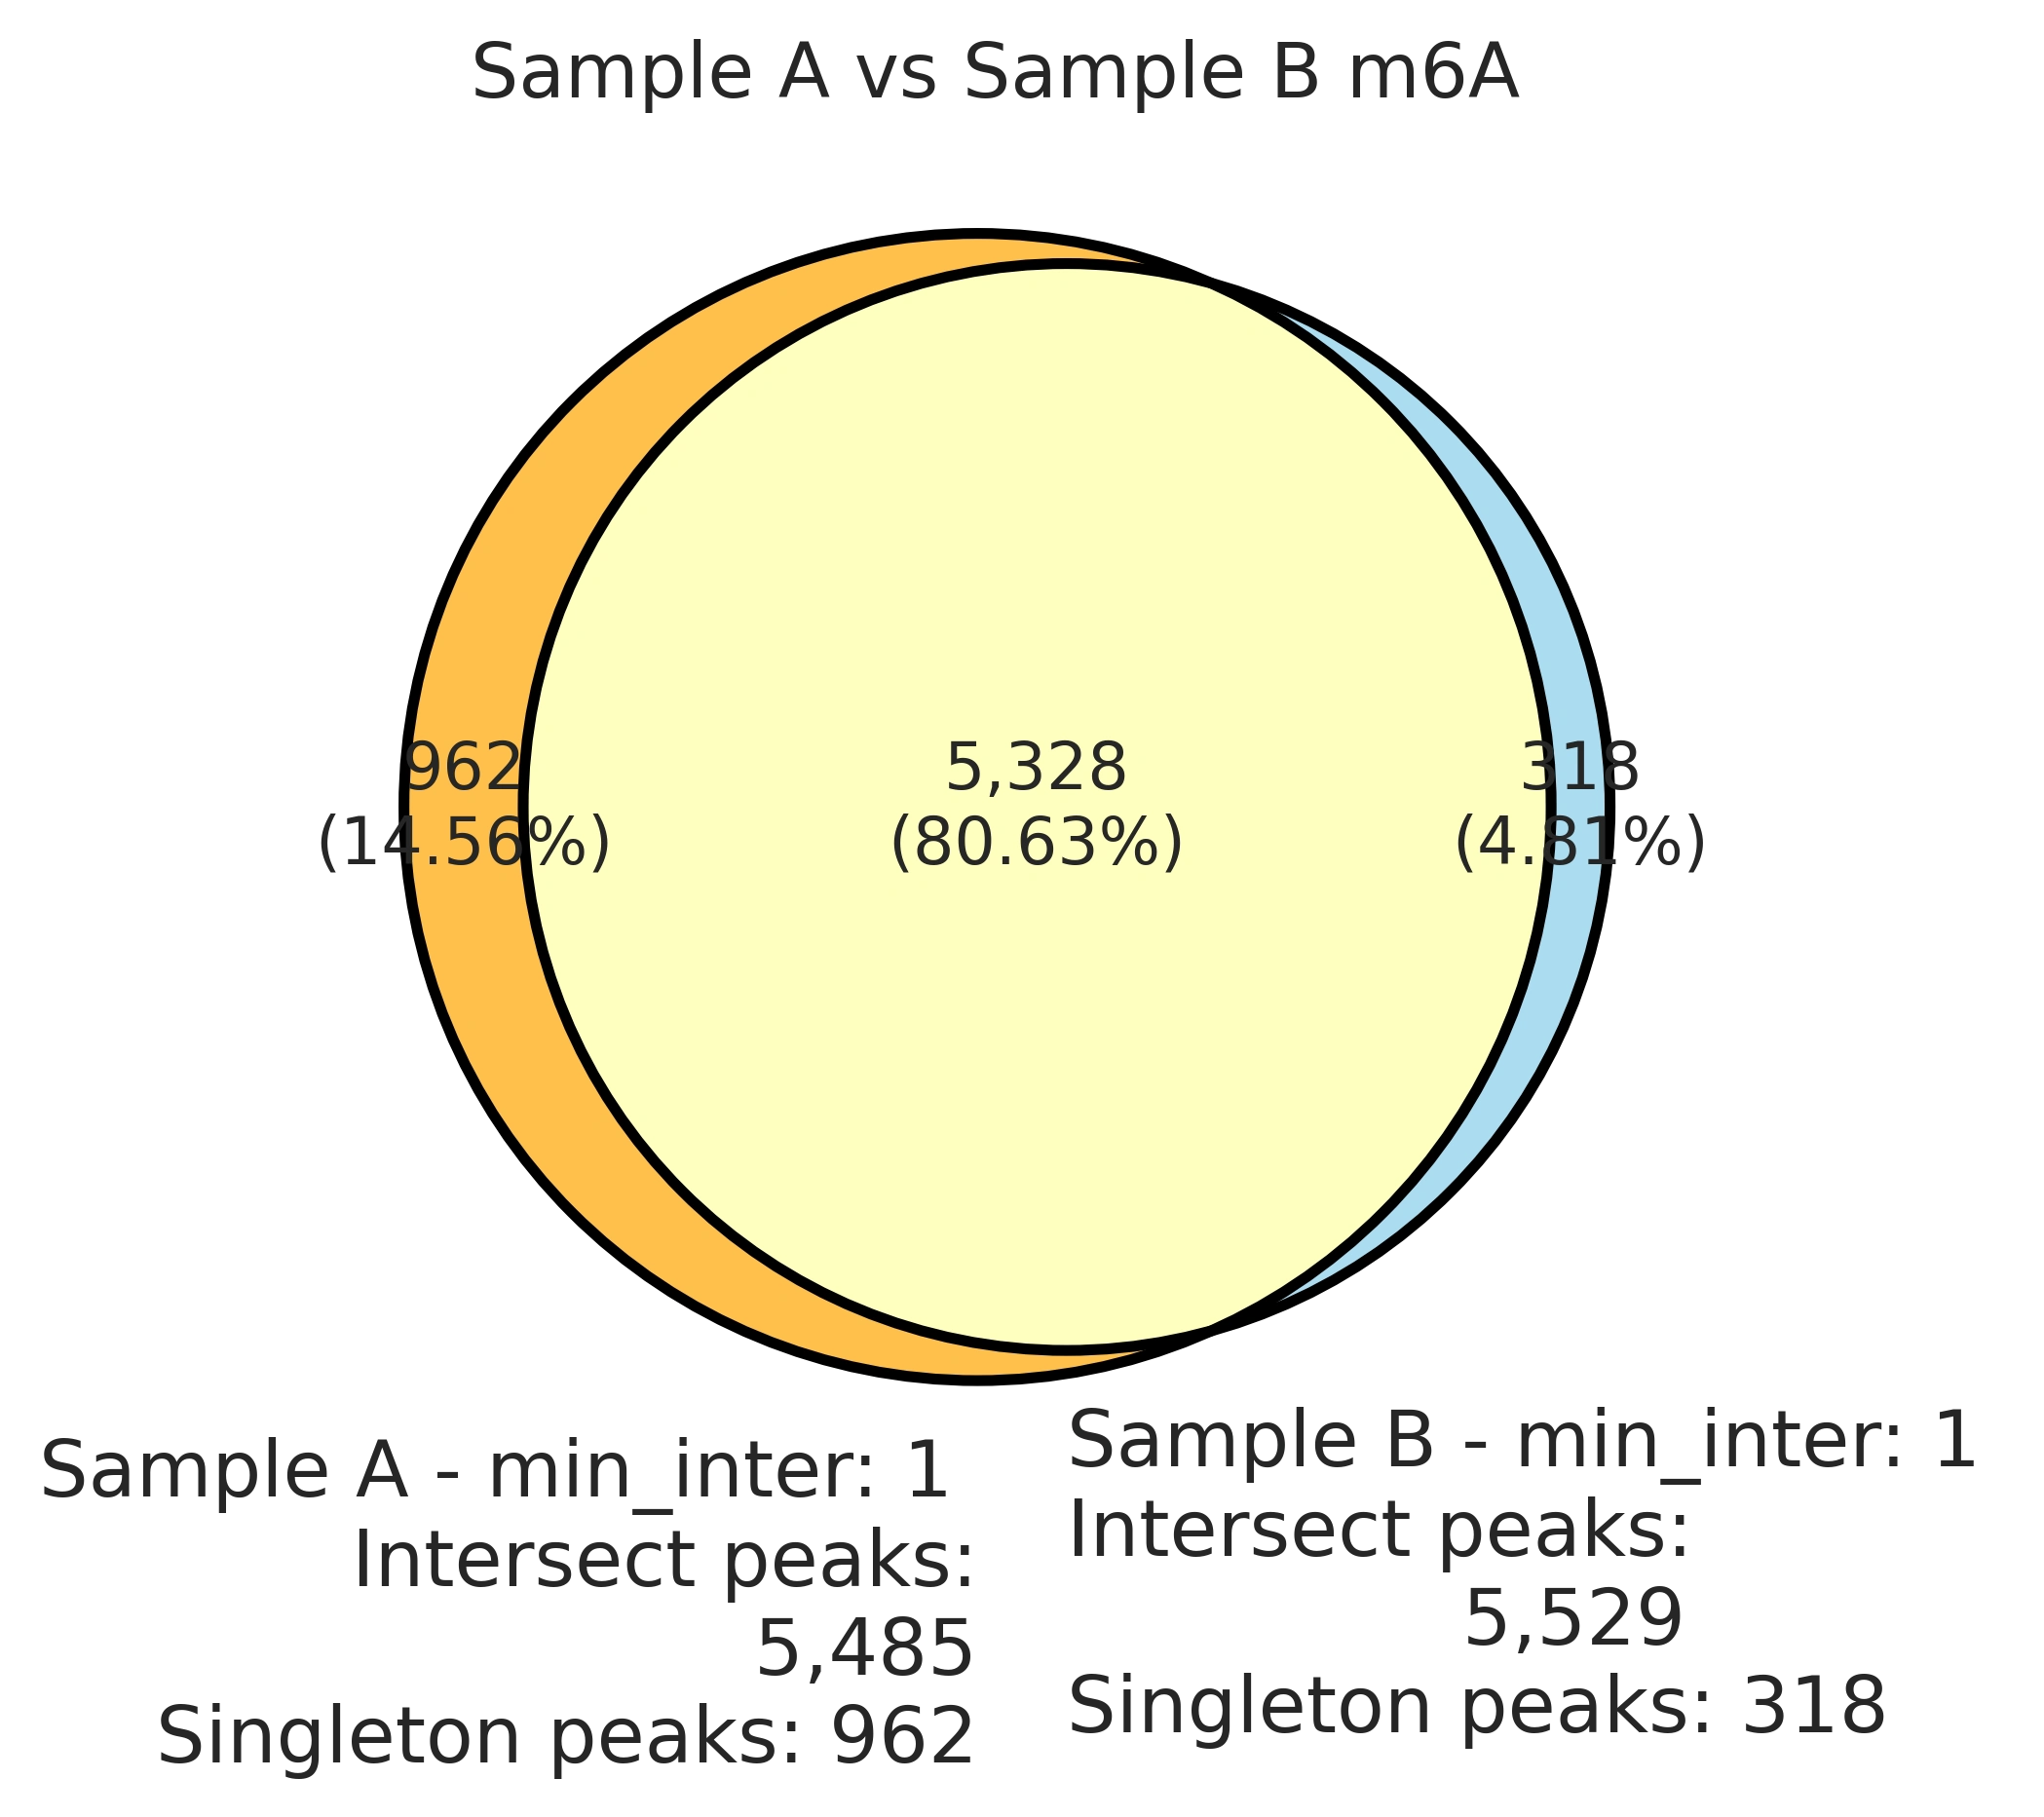
Venn diagram of the m6A peak locations in rep1 versus rep2. More than 80% of the m6A peaks are found in the exact same location in both technical replicates.
EpiPlex assay retains performance with low RNA inputs
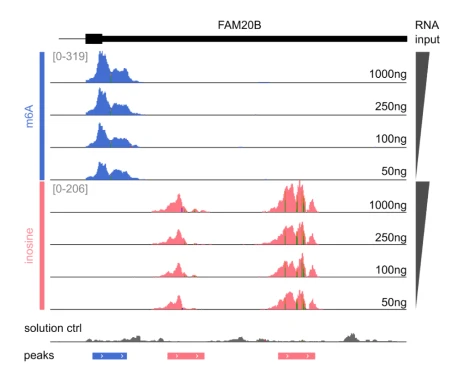
Genome browser view of the FAM20B gene. Sample input was titrated between 1,000 ng to 50 ng of total RNA. The m6A and inosine peaks are detected at all RNA input concentrations, with the raw read counts titrating with input concentration.
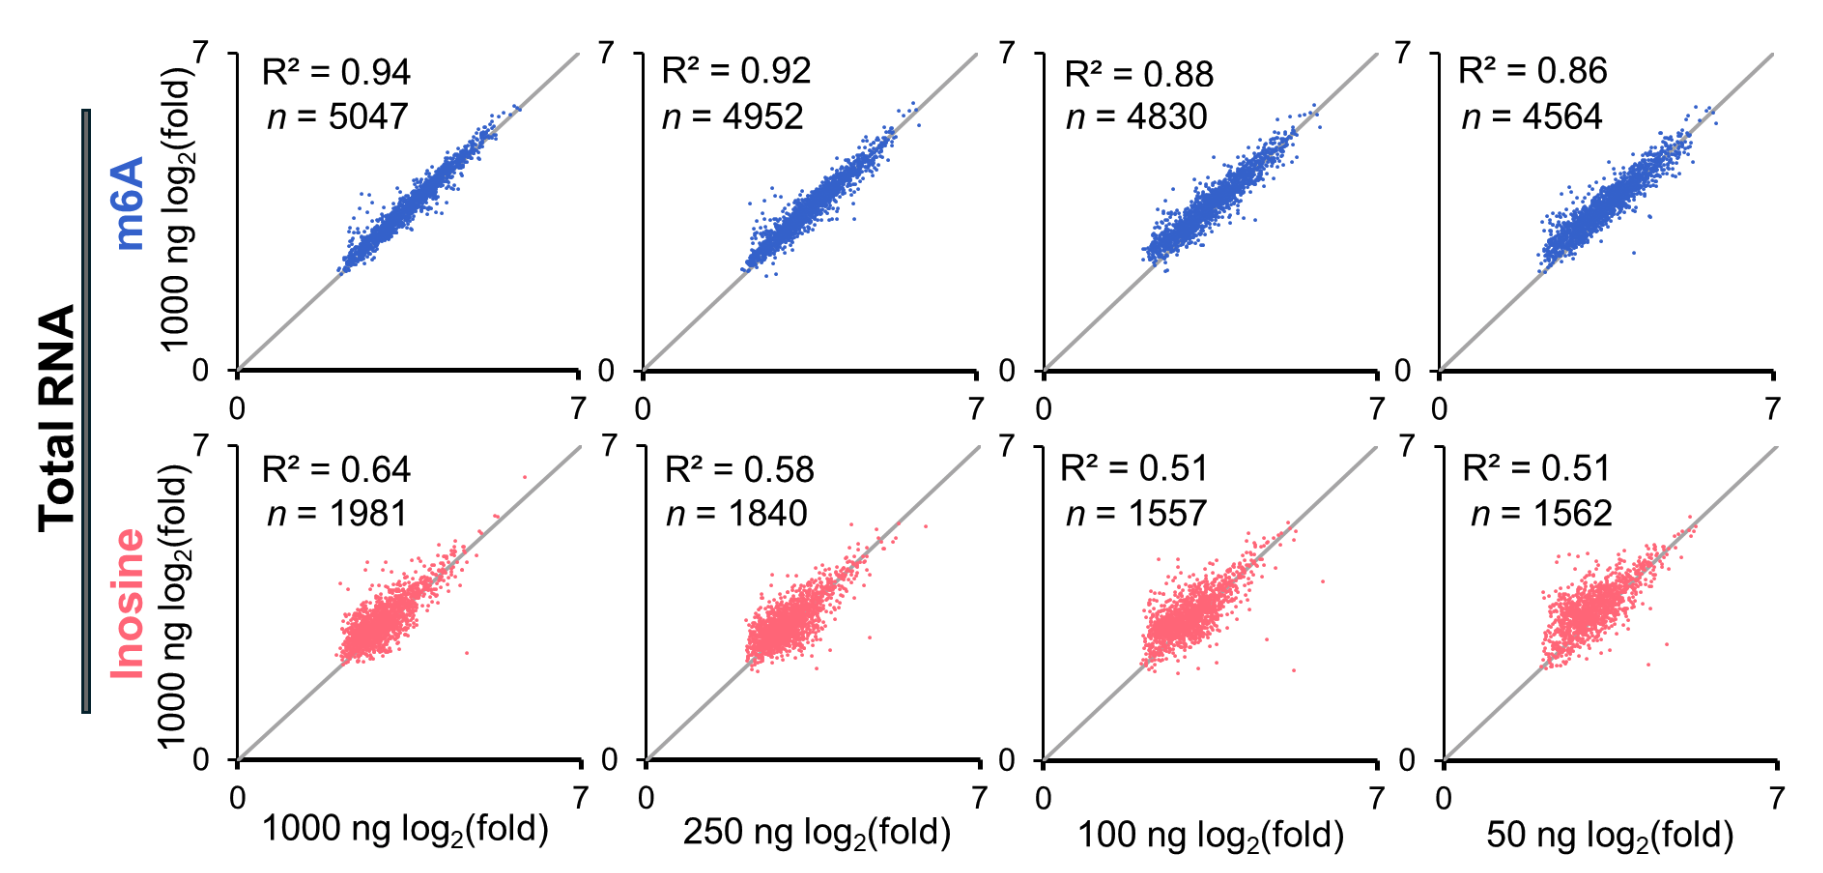
Correlation plots of fold enrichment values determined for the highest sample input compared to the fold enrichment values obtained for all other RNA input amounts. The data highlight successful raw read normalization, allowing for accurate RNA modification abundance determination.
EpiPlex Assay uncovers RNA modification differences between cell types
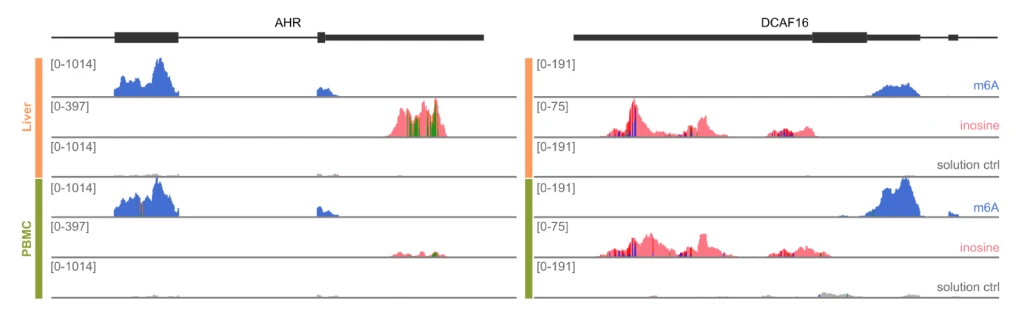
Comparison of two arbitrary genes and their modification pattern obtained by analyzing RNA isolated liver tissue or Peripheral Blood Mononuclear Cells (PBMCs). The AHR gene shows preservation of the m6A sites in both sample types, whereas the inosine sites are missing in PBMC RNA. In the DCAF16 gene, the inosine sites are present in both samples, whereas the abundance of m6A is diminished in liver RNA.
EpiPlex RNA‑Seq Libraries Offer Excellent Reproducibility and Minimal Bias
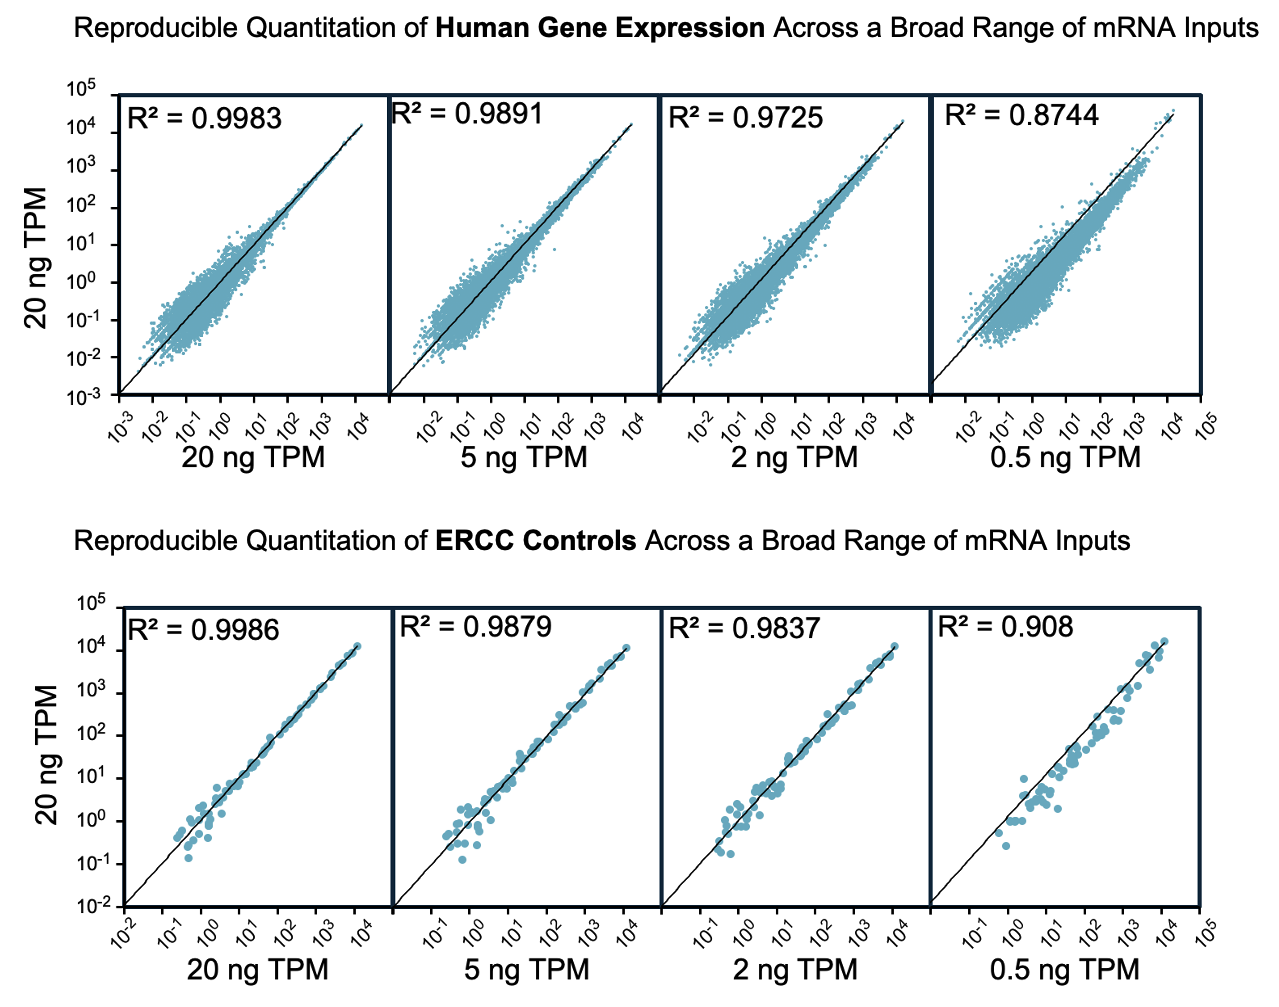
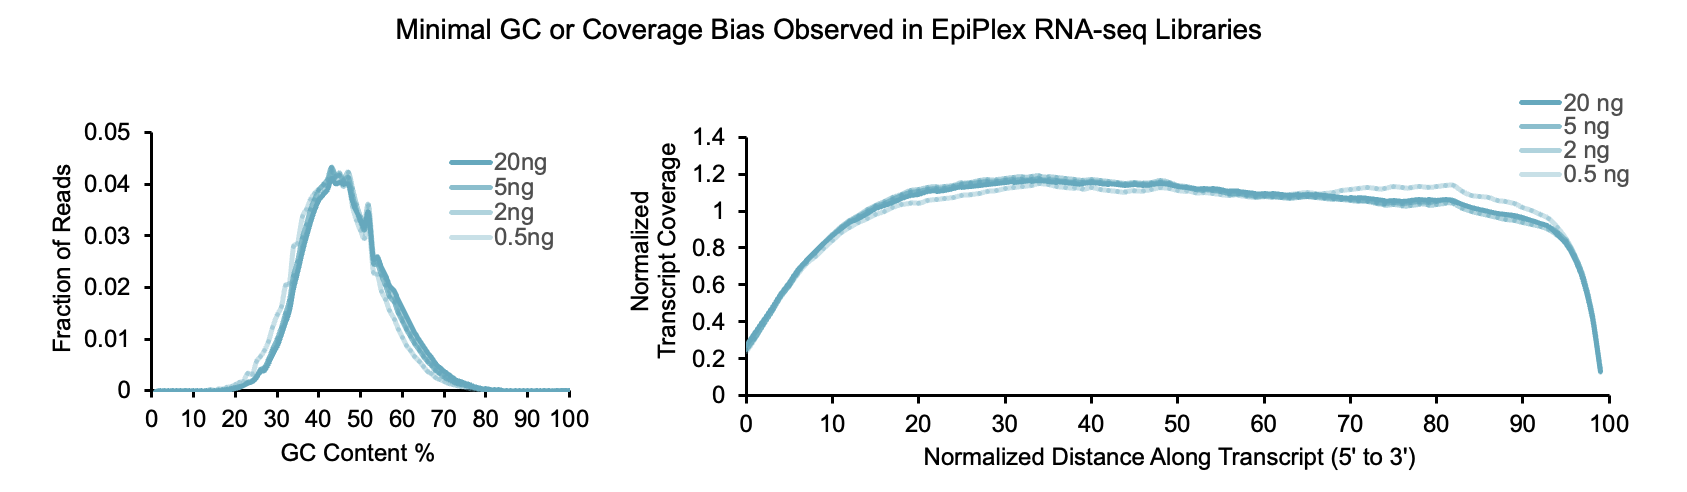
RNA‑seq data generated using the EpiPlex kit demonstrate high technical reproducibility and minimal GC coverage bias. Libraries were prepared from poly(A)‑selected A549 RNA (0.5–20 ng input) with 0.1% ERCC spike‑ins. Across this range, EpiPlex consistently detected 14,460–15,203 expressed genes and accurately quantified transcript levels using TPM. Performance benchmarking confirms that EpiPlex libraries perform on par with leading commercial kits, even at low input.
Learn more about how EpiPlex supports high‑fidelity gene expression profiling in our RNA‑seq technical note.